Data analysis platform
Collection, visualization and models for monitoring and predictive investigations
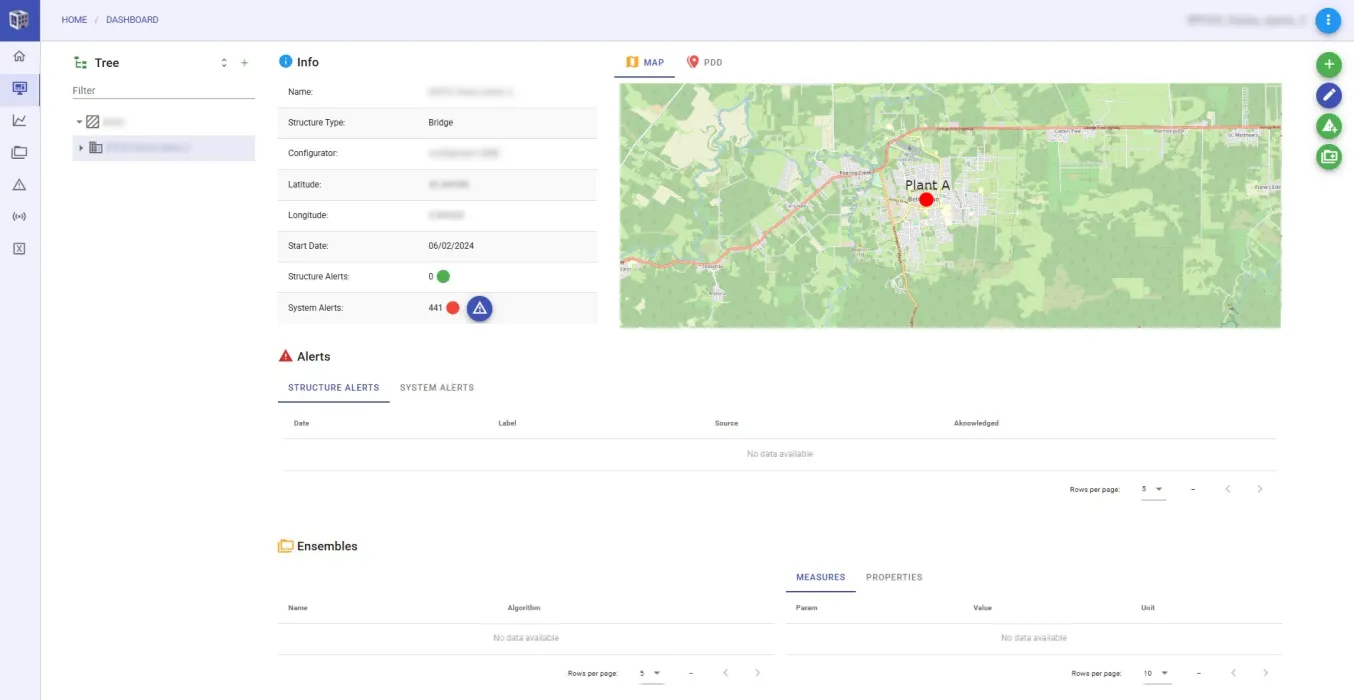
Comprehensive monitoring
Get a quick overview of your asset. Immediately check the system's health status, intuitively verify the latest data or active alarms.
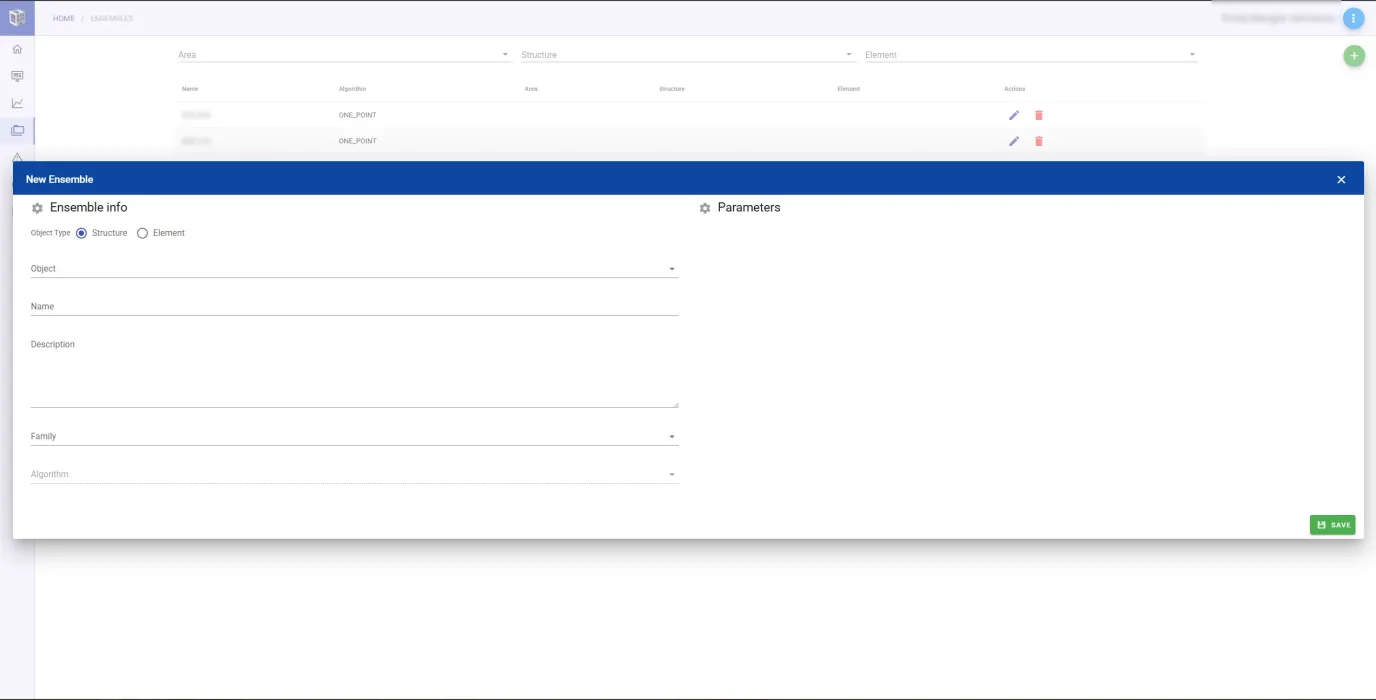
Custom datasets
Build your data in a personalized way. You can collect direct sensor information, or create your own dataset based on statistical or geometric criteria, to keep information under control in the most convenient way possible.
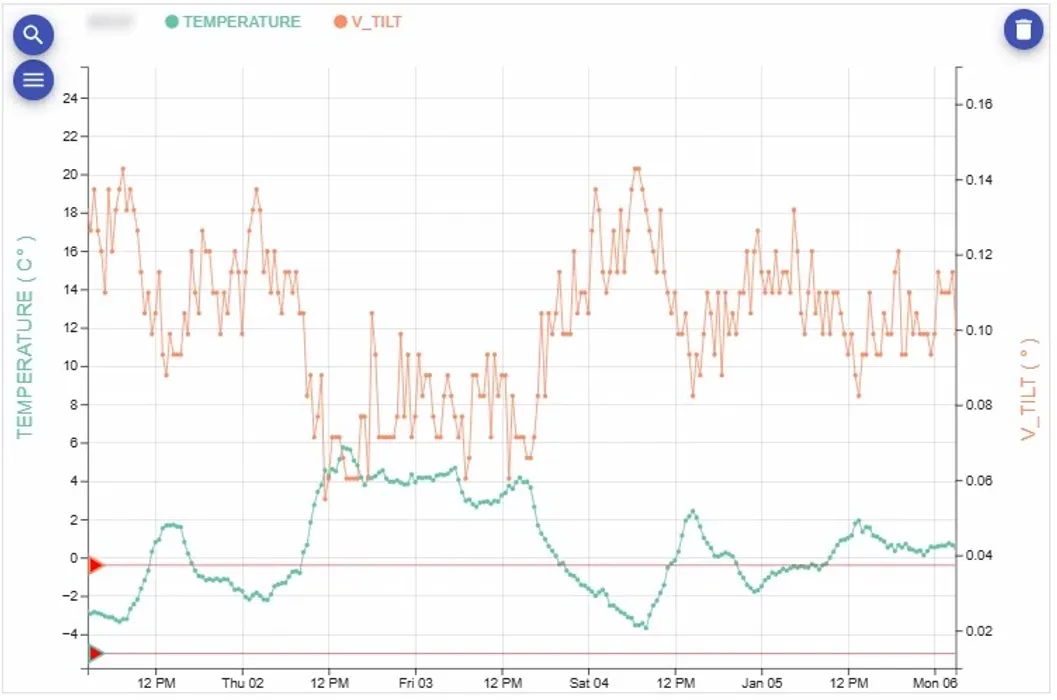
Data visualization
Display collected data using customizable widgets. You can compare multiple parameters related to a sensor, or analyze the behavior of multiple sensors on a specific parameter. Observe the timeline to discover anomalies in historical trends, also in relation to established alarm thresholds.
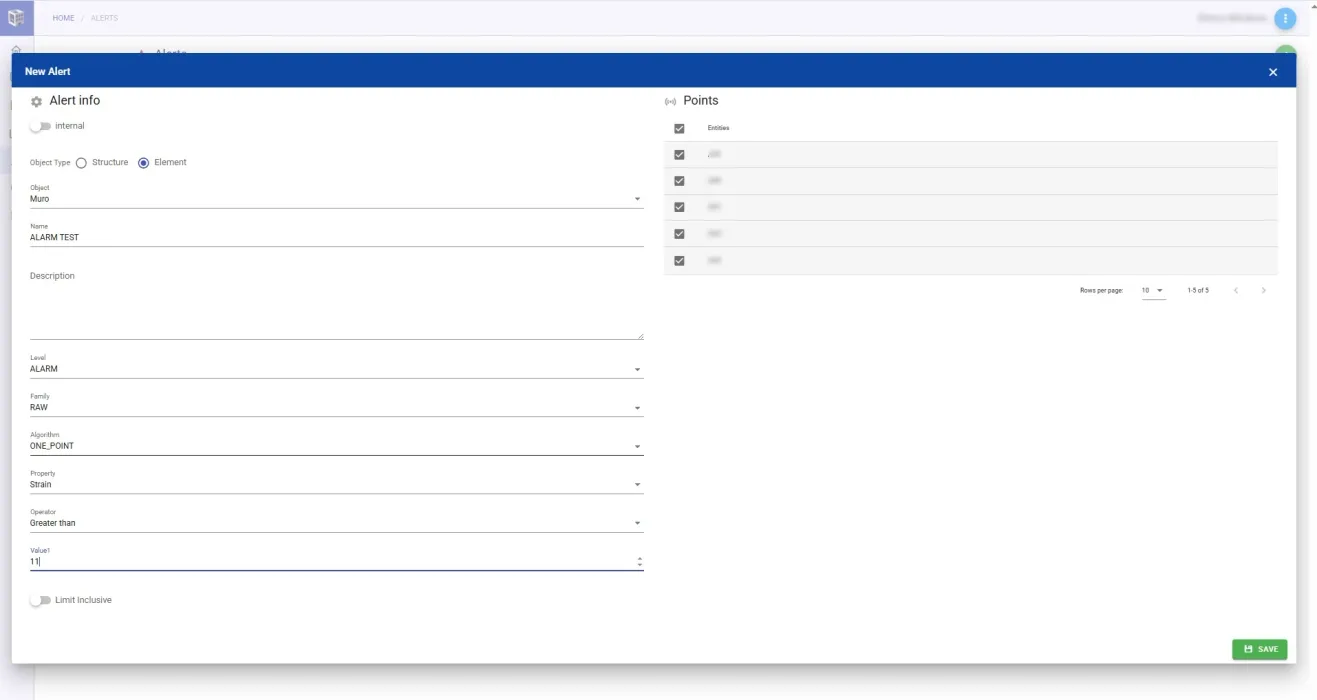
Alarm management
Define alarms by monitoring a target parameter, assigning a threshold value and extending the rule to one or more sensors. When thresholds are exceeded, you will receive email notifications. Monitor and manage active alarms.
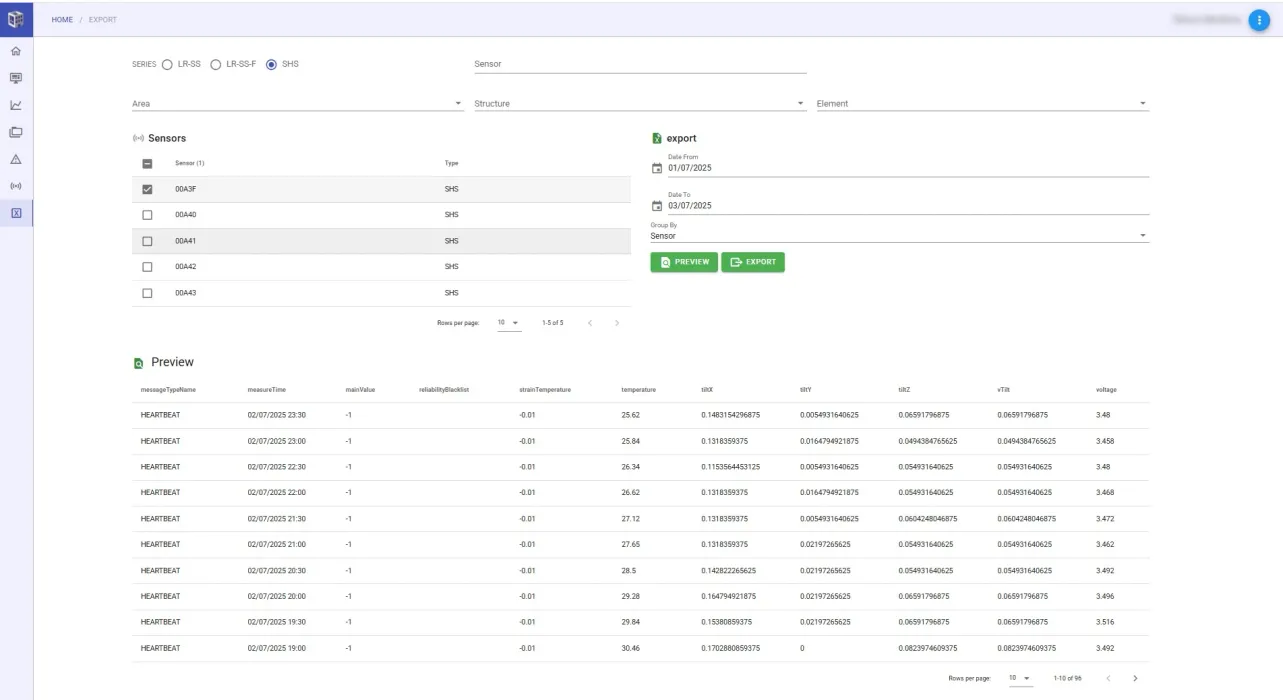
Interoperability
Access your data even offline. Export your dataset in CSV or Excel format, or synchronize information with your software through our APIs.